Metaforecast late 2022 update: GraphQL API, Charts, better infrastructure behind the scenes.
tl;dr: Metaforecast is a search engine and an associated repository for forecasting questions. Since our last update, we have added a GraphQL API, charts, and dashboards. We have also reworked our infrastructure to make it more stable.
New API
Our most significant new addition is our GraphQL API. It allows other people to build on top of our efforts. It can be accessed on metaforecast.org/api/graphql, and looks similar to the EA Forum's own graphql api.
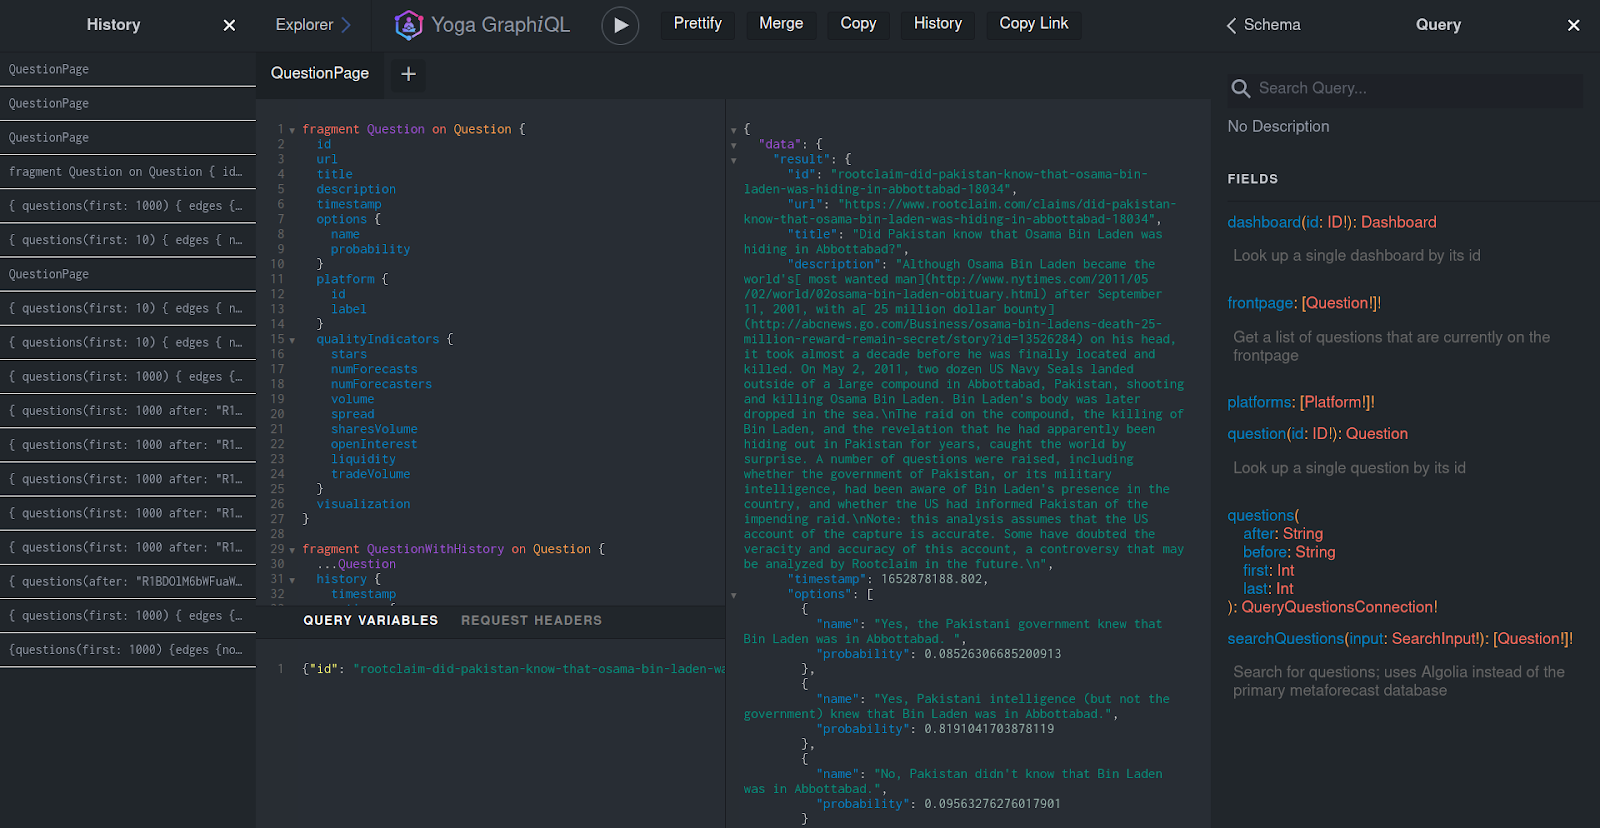
To get the first 1000 questions, you could use a query like:
{
  questions(first: 1000) {
    edges {
      node {
        id
        title
        url
        description
        options {
          name
          probability
        }
        qualityIndicators {
          numForecasts
          stars
        }
        timestamp
      }
    }
    pageInfo {
      endCursor
      startCursor
    }
  }
}
You can find more examples, like code to download all questions, in our /scripts folder, to which we welcome contributions.
Charts and question pages.
Charts display a question’s history. They look as follows:
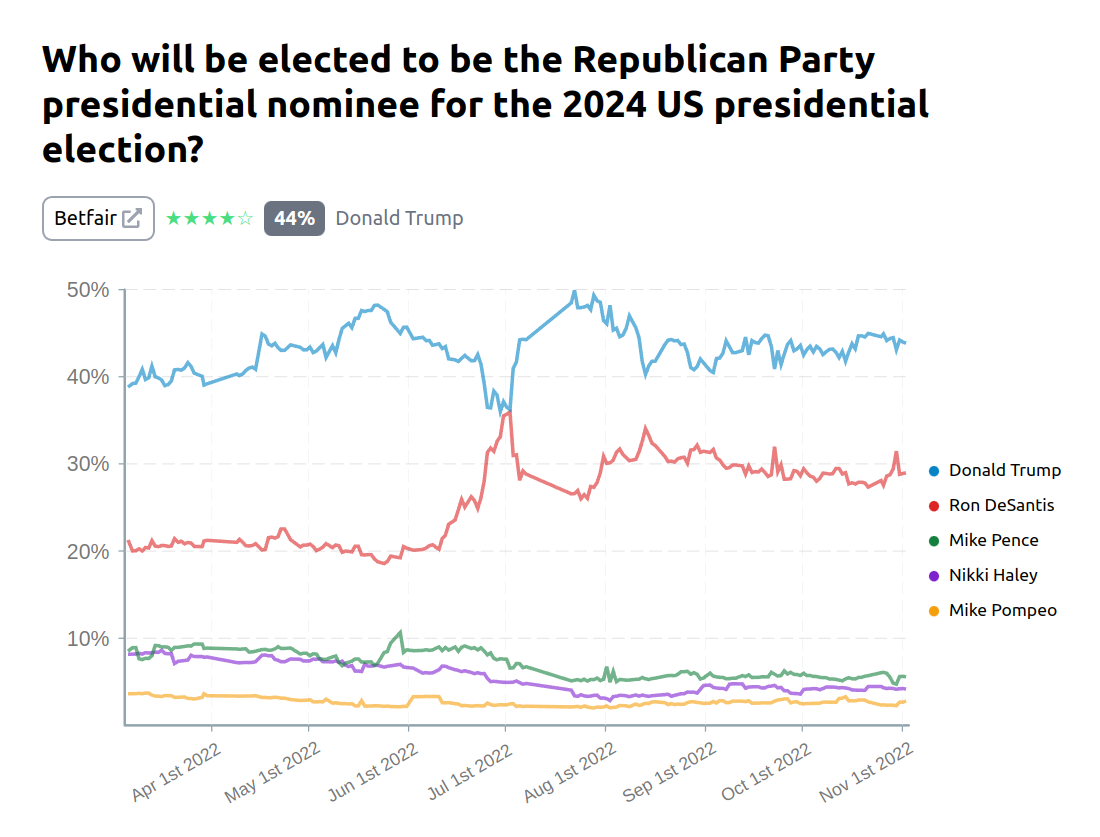
Charts can be accessed by clicking the expand button on the front page although they are fairly slow to load at the moment.
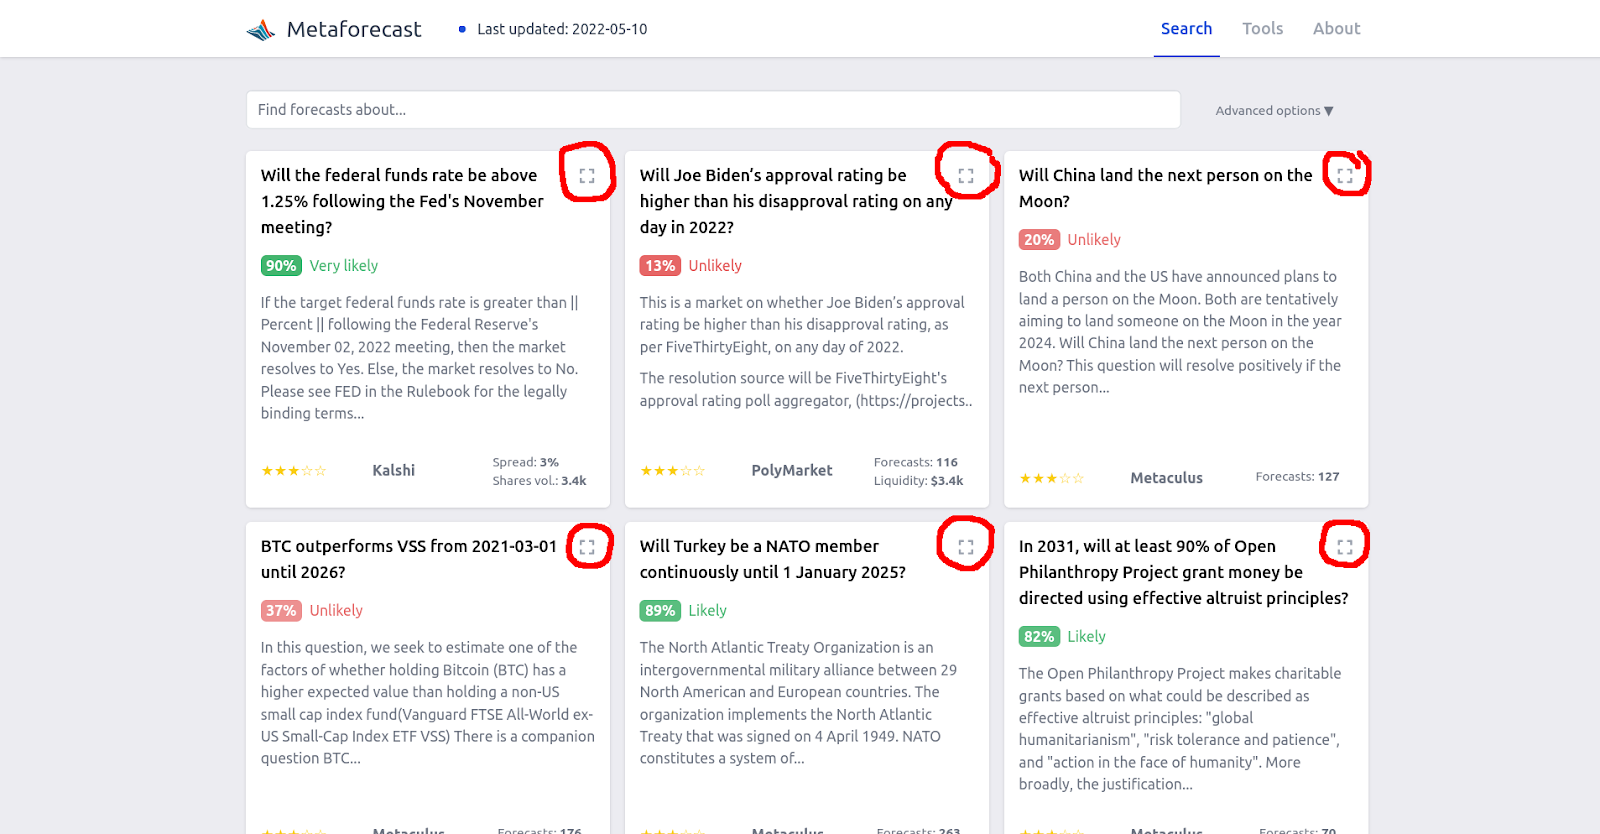
Clicking on the expand button brings the user to a question page, which contains a chart, the full question description, and a range of quality indicators:
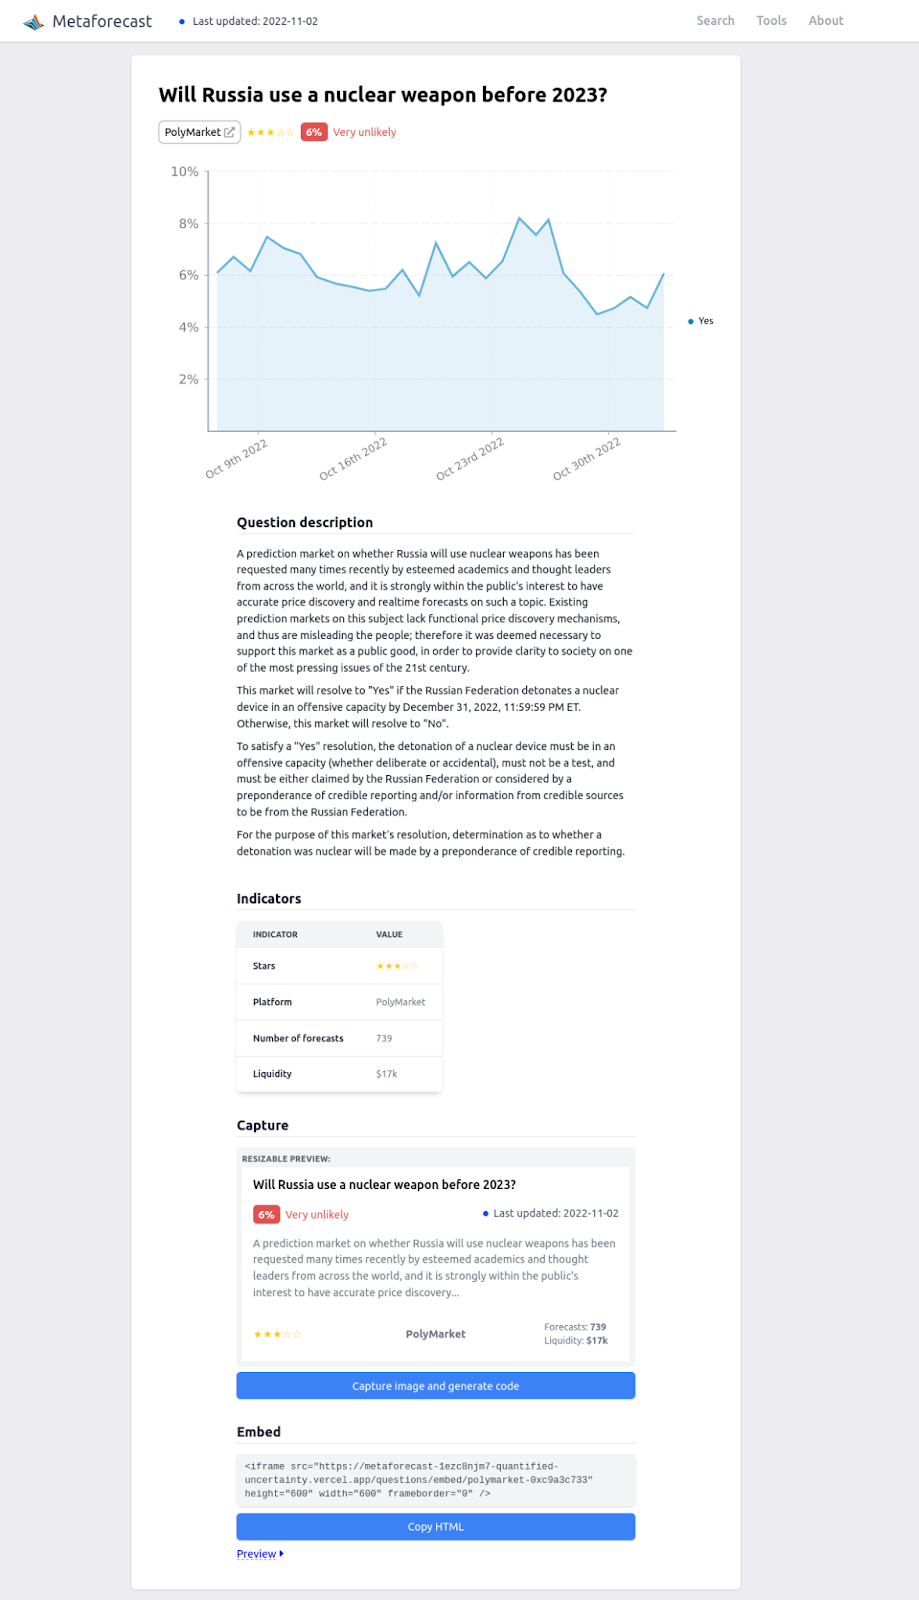
We are also providing an endpoint at metaforecast.org/questions/embed/\[id\] to allow other pages to embed our charts. For instance, to embed a question whose id is betfair-1.178163916, the endpoint would be here. One would use it in the following code:
<iframe
  src="https://metaforecast.org/questions/embed/betfair-1.178163916"
  height="200"
  width="300"
  title="Metaforecast question"
></iframe>
You can find the necessary question id by clicking a toggle under “advanced options” on the frontpage, or simply by noticing the id in our URL when expanding the question.
With time, we aim to improve these pages, make them more interactive, etc. We also think it would be a good idea to embed Metaforecast questions and dashboards into the EA Forum, and we are trying to collaborate with the Manifold team, who have done this before, to make that happen.
Dashboards
Dashboards are collections of questions. For instance, here is a dashboard on global markets and inflation, as embedded in Global Guessing.
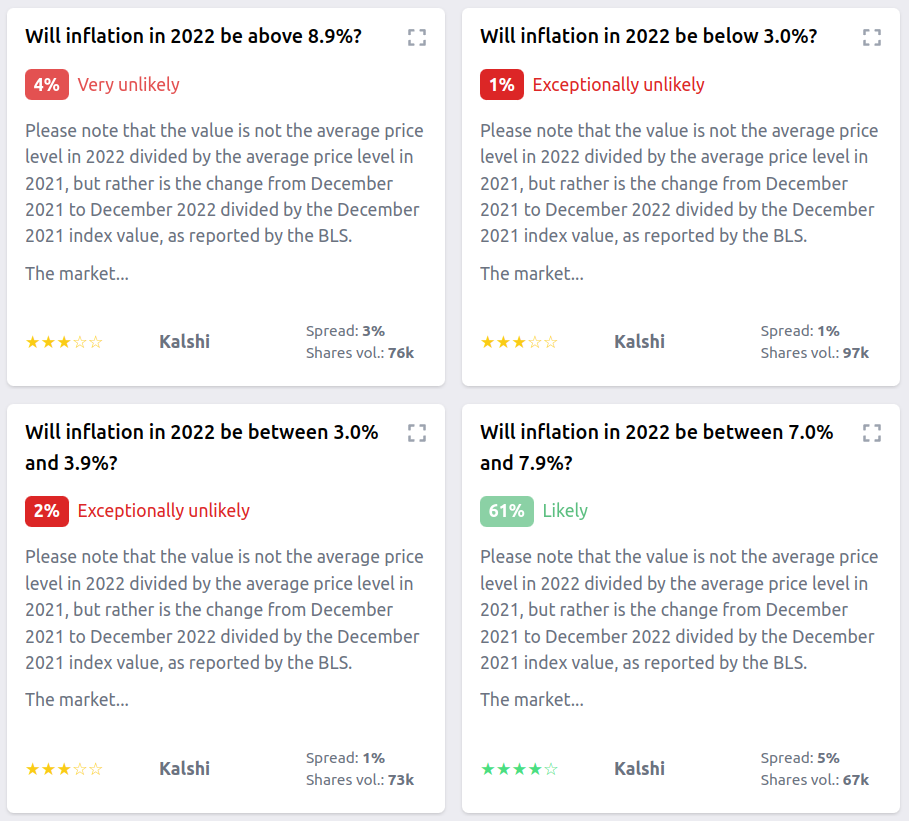
Like questions, you can either view dashboards directly, or embed them. You can also create them, at https://metaforecast.org/dashboards.
Better infrastructure
We have also revamped our infrastructure. We moved to from JavaScript to Typescript, from MongoDB to Postgres, and simplified our backend.
We are open to collaborations
We are very much open to collaborations. If you want to integrate Metaforecast into your project and need help do not hesitate to reach out, e.g., on our Github.
Metaforecast is also open source, and we welcome contributions. You can see some to-dos here. Developing is going more slowly now because it’s mostly driven by Nuño working in his spare time, so contributions would be counterfactual.
Acknowledgements
![]()
Metaforecast is hosted by the Quantified Uncertainty Research Institute, and has received funding from Astral Codex Ten. It has received significant contributions from Vyacheslav Matyuhin, who was responsible for the upgrade to Typescript and GraphQL. Thanks to Clay Graubard of Global Guessing for their comments and dashboards, to Insight Prediction for help smoothing out their API, to Nathan Young for general comments, to others for their comments and suggestions.